Chapter 7 Section 7.3: Dating Planetary Surfaces
7.3 Dating Planetary Surfaces
Learning Objectives
By the end of this section, you will be able to:
- Explain how astronomers can tell whether a planetary surface is geologically young or old
- Describe different methods for dating planets
How do we know the age of the surfaces we see on planets and moons? If a world has a surface (as opposed to being mostly gas and liquid), astronomers have developed some techniques for estimating how long ago that surface solidified. Note that the age of these surfaces is not necessarily the age of the planet as a whole. On geologically active objects (including Earth), vast outpourings of molten rock or the erosive effects of water and ice, which we call planet weathering, have erased evidence of earlier epochs and present us with only a relatively young surface for investigation.
Counting the Craters
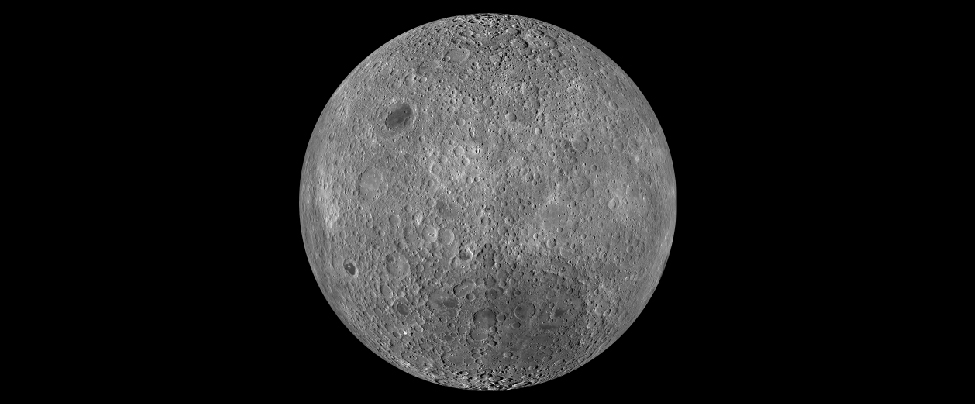
One way to estimate the age of a surface is by counting the number of impact craters. This technique works because the rate at which impacts have occurred in the solar system has been roughly constant for several billion years. Thus, in the absence of forces to eliminate craters, the number of craters is simply proportional to the length of time the surface has been exposed. This technique has been applied successfully to many solid planets and moons (Figure 1).
Our Cratered Moon.

Figure 1. This composite image of the Moon’s surface was made from many smaller images taken between November 2009 and February 2011 by the Lunar Reconnaissance Orbiter (LRO) and shows craters of many different sizes. (credit: modification of work by NASA/GSFC/Arizona State University)
Bear in mind that crater counts can tell us only the time since the surface experienced a major change that could modify or erase preexisting craters. Estimating ages from crater counts is a little like walking along a sidewalk in a snowstorm after the snow has been falling steadily for a day or more. You may notice that in front of one house the snow is deep, while next door the sidewalk may be almost clear. Do you conclude that less snow has fallen in front of Ms. Jones’ house than Mr. Smith’s? More likely, you conclude that Jones has recently swept the walk clean and Smith has not. Similarly, the numbers of craters indicate how long it has been since a planetary surface was last “swept clean” by ongoing lava flows or by molten materials ejected when a large impact happened nearby.
Still, astronomers can use the numbers of craters on different parts of the same world to provide important clues about how regions on that world evolved. On a given planet or moon, the more heavily cratered terrain will generally be older (that is, more time will have elapsed there since something swept the region clean).
Radioactive Rocks
Another way to trace the history of a solid world is to measure the age of individual rocks. After samples were brought back from the Moon by Apollo astronauts, the techniques that had been developed to date rocks on Earth were applied to rock samples from the Moon to establish a geological chronology for the Moon. Furthermore, a few samples of material from the Moon, Mars, and the large asteroid Vesta have fallen to Earth as meteorites and can be examined directly (see the chapter on Cosmic Samples and the Origin of the Solar System).
Scientists measure the age of rocks using the properties of natural radioactivity. Around the beginning of the twentieth century, physicists began to understand that some atomic nuclei are not stable but can split apart (decay) spontaneously into smaller nuclei. The process of radioactive decay involves the emission of particles such as electrons, or of radiation in the form of gamma rays (see the chapter on Radiation and Spectra).
For any one radioactive nucleus, it is not possible to predict when the decay process will happen. Such decay is random in nature, like the throw of dice: as gamblers have found all too often, it is impossible to say just when the dice will come up 7 or 11. But, for a very large number of dice tosses, we can calculate the odds that 7 or 11 will come up. Similarly, if we have a very large number of radioactive atoms of one type (say, uranium), there is a specific time period, called its half-life, during which the chances are fifty-fifty that decay will occur for any of the nuclei.
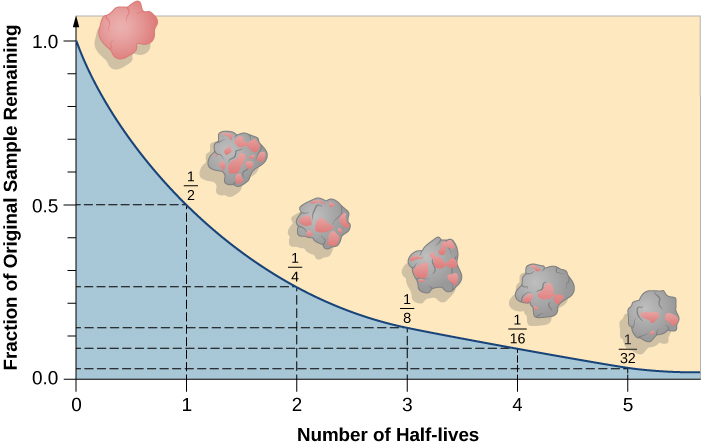
A particular nucleus may last a shorter or longer time than its half-life, but in a large sample, almost exactly half of the nuclei will have decayed after a time equal to one half-life. Half of the remaining nuclei will have decayed after two half-lives pass, leaving only one half of a half—or one quarter—of the original sample (Figure 2).
Radioactive Decay.

Figure 2. This graph shows (in pink) the amount of a radioactive sample that remains after several half-lives have passed. After one half-life, half the sample is left; after two half-lives, one half of the remainder (or one quarter) is left; and after three half-lives, one half of that (or one eighth) is left. Note that, in reality, the decay of radioactive elements in a rock sample would not cause any visible change in the appearance of the rock; the splashes of color are shown here for conceptual purposes only.
If you had 1 gram of pure radioactive nuclei with a half-life of 100 years, then after 100 years you would have 1/2 gram; after 200 years, 1/4 gram; after 300 years, only 1/8 gram; and so forth. However, the material does not disappear. Instead, the radioactive atoms are replaced with their decay products. Sometimes the radioactive atoms are called parents and the decay products are called daughter elements.
In this way, radioactive elements with half-lives we have determined can provide accurate nuclear clocks. By comparing how much of a radioactive parent element is left in a rock to how much of its daughter products have accumulated, we can learn how long the decay process has been going on and hence how long ago the rock formed. Table summarizes the decay reactions used most often to date lunar and terrestrial rocks.
| Radioactive Decay Reaction Used to Date Rocks1 | ||
|---|---|---|
| Parent | Daughter | Half-Life (billions of years) |
| Samarium-147 | Neodymium-143 | 106 |
| Rubidium-87 | Strontium-87 | 48.8 |
| Thorium-232 | Lead-208 | 14.0 |
| Uranium-238 | Lead-206 | 4.47 |
| Potassium-40 | Argon-40 | 1.31 |
PBS provides an evolution series excerpt that explains how we use radioactive elements to date Earth.
This Science Channel video features Bill Nye the Science Guy showing how scientists have used radioactive dating to determine the age of Earth.
When astronauts first flew to the Moon, one of their most important tasks was to bring back lunar rocks for radioactive age-dating. Until then, astronomers and geologists had no reliable way to measure the age of the lunar surface. Counting craters had let us calculate relative ages (for example, the heavily cratered lunar highlands were older than the dark lava plains), but scientists could not measure the actual age in years. Some thought that the ages were as young as those of Earth’s surface, which has been resurfaced by many geological events. For the Moon’s surface to be so young would imply active geology on our satellite. Only in 1969, when the first Apollo samples were dated, did we learn that the Moon is an ancient, geologically dead world. Using such dating techniques, we have been able to determine the ages of both Earth and the Moon: each was formed about 4.5 billion years ago (although, as we shall see, Earth probably formed earlier).
We should also note that the decay of radioactive nuclei generally releases energy in the form of heat. Although the energy from a single nucleus is not very large (in human terms), the enormous numbers of radioactive nuclei in a planet or moon (especially early in its existence) can be a significant source of internal energy for that world. Geologists estimate that about half of Earth’s current internal heat budget comes from the decay of radioactive isotopes in its interior.
Key Concepts and Summary
The ages of the surfaces of objects in the solar system can be estimated by counting craters: on a given world, a more heavily cratered region will generally be older than one that is less cratered. We can also use samples of rocks with radioactive elements in them to obtain the time since the layer in which the rock formed last solidified. The half-life of a radioactive element is the time it takes for half the sample to decay; we determine how many half-lives have passed by how much of a sample remains the radioactive element and how much has become the decay product. In this way, we have estimated the age of the Moon and Earth to be roughly 4.5 billion years.
Footnotes
Glossary
- half-life
- time required for half of the radioactive atoms in a sample to disintegrate
- radioactivity
- process by which certain kinds of atomic nuclei decay naturally, with the spontaneous emission of subatomic particles and gamma rays

