Chapter 17 Section 17.3: The Spectra of Stars (and Brown Dwarfs)
17.3 The Spectra of Stars (and Brown Dwarfs)
Learning Objectives
By the end of this section, you will be able to:
- Describe how astronomers use spectral classes to characterize stars
- Explain the difference between a star and a brown dwarf
Measuring colors is only one way of analyzing starlight. Another way is to use a spectrograph to spread out the light into a spectrum (see the Radiation and Spectra and the Astronomical Instruments chapters). In 1814, the German physicist Joseph Fraunhofer observed that the spectrum of the Sun shows dark lines crossing a continuous band of colors. In the 1860s, English astronomers Sir William Huggins and Lady Margaret Huggins (Figure 1) succeeded in identifying some of the lines in stellar spectra as those of known elements on Earth, showing that the same chemical elements found in the Sun and planets exist in the stars. Since then, astronomers have worked hard to perfect experimental techniques for obtaining and measuring spectra, and they have developed a theoretical understanding of what can be learned from spectra. Today, spectroscopic analysis is one of the cornerstones of astronomical research.
William Huggins (1824–1910) and Margaret Huggins (1848–1915).
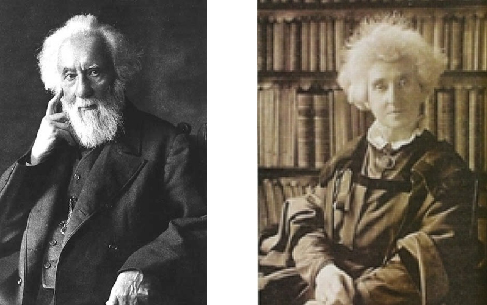
Figure 1. William and Margaret Huggins were the first to identify the lines in the spectrum of a star other than the Sun; they also took the first spectrogram, or photograph of a stellar spectrum.
Formation of Stellar Spectra
When the spectra of different stars were first observed, astronomers found that they were not all identical. Since the dark lines are produced by the chemical elements present in the stars, astronomers first thought that the spectra differ from one another because stars are not all made of the same chemical elements. This hypothesis turned out to be wrong. The primary reason that stellar spectra look different is because the stars have different temperatures. Most stars have nearly the same composition as the Sun, with only a few exceptions.
Hydrogen, for example, is by far the most abundant element in most stars. However, lines of hydrogen are not seen in the spectra of the hottest and the coolest stars. In the atmospheres of the hottest stars, hydrogen atoms are completely ionized. Because the electron and the proton are separated, ionized hydrogen cannot produce absorption lines. (Recall from the Formation of Spectral Lines section, the lines are the result of electrons in orbit around a nucleus changing energy levels.)
In the atmospheres of the coolest stars, hydrogen atoms have their electrons attached and can switch energy levels to produce lines. However, practically all of the hydrogen atoms are in the lowest energy state (unexcited) in these stars and thus can absorb only those photons able to lift an electron from that first energy level to a higher level. Photons with enough energy to do this lie in the ultraviolet part of the electromagnetic spectrum, and there are very few ultraviolet photons in the radiation from a cool star. What this means is that if you observe the spectrum of a very hot or very cool star with a typical telescope on the surface of Earth, the most common element in that star, hydrogen, will show very weak spectral lines or none at all.
The hydrogen lines in the visible part of the spectrum (called Balmer lines) are strongest in stars with intermediate temperatures—not too hot and not too cold. Calculations show that the optimum temperature for producing visible hydrogen lines is about 10,000 K. At this temperature, an appreciable number of hydrogen atoms are excited to the second energy level. They can then absorb additional photons, rise to still-higher levels of excitation, and produce a dark absorption line. Similarly, every other chemical element, in each of its possible stages of ionization, has a characteristic temperature at which it is most effective in producing absorption lines in any particular part of the spectrum.
Classification of Stellar Spectra
Astronomers use the patterns of lines observed in stellar spectra to sort stars into a spectral class. Because a star’s temperature determines which absorption lines are present in its spectrum, these spectral classes are a measure of its surface temperature. There are seven standard spectral classes. From hottest to coldest, these seven spectral classes are designated O, B, A, F, G, K, and M. Recently, astronomers have added three additional classes for even cooler objects—L, T, and Y.
At this point, you may be looking at these letters with wonder and asking yourself why astronomers didn’t call the spectral types A, B, C, and so on. You will see, as we tell you the history, that it’s an instance where tradition won out over common sense.
In the 1880s, Williamina Fleming devised a system to classify stars based on the strength of hydrogen absorption lines. Spectra with the strongest lines were classified as “A” stars, the next strongest “B,” and so on down the alphabet to “O” stars, in which the hydrogen lines were very weak. But we saw above that hydrogen lines alone are not a good indicator for classifying stars, since their lines disappear from the visible light spectrum when the stars get too hot or too cold.
In the 1890s, Annie Jump Cannon revised this classification system, focusing on just a few letters from the original system: A, B, F, G, K, M, and O. Instead of starting over, Cannon also rearranged the existing classes—in order of decreasing temperature—into the sequence we have learned: O, B, A, F, G, K, M. As you can read in the feature on Annie Cannon: Classifier of the Stars in this chapter, she classified around 500,000 stars over her lifetime, classifying up to three stars per minute by looking at the stellar spectra.
To help astronomers remember this crazy order of letters, Cannon created a mnemonic, “Oh Be A Fine Girl, Kiss Me.” (If you prefer, you can easily substitute “Guy” for “Girl.”) Other mnemonics, which we hope will not be relevant for you, include “Oh Brother, Astronomers Frequently Give Killer Midterms” and “Oh Boy, An F Grade Kills Me!” With the new L, T, and Y spectral classes, the mnemonic might be expanded to “Oh Be A Fine Girl (Guy), Kiss Me Like That, Yo!”
Each of these spectral classes, except possibly for the Y class which is still being defined, is further subdivided into 10 subclasses designated by the numbers 0 through 9. A B0 star is the hottest type of B star; a B9 star is the coolest type of B star and is only slightly hotter than an A0 star.
And just one more item of vocabulary: for historical reasons, astronomers call all the elements heavier than helium metals, even though most of them do not show metallic properties. (If you are getting annoyed at the peculiar jargon that astronomers use, just bear in mind that every field of human activity tends to develop its own specialized vocabulary. Just try reading a credit card or social media agreement form these days without training in law!)
Let’s take a look at some of the details of how the spectra of the stars change with temperature. (It is these details that allowed Annie Cannon to identify the spectral types of stars as quickly as three per minute!) As Figure 2 shows, in the hottest O stars (those with temperatures over 28,000 K), only lines of ionized helium and highly ionized atoms of other elements are conspicuous. Hydrogen lines are strongest in A stars with atmospheric temperatures of about 10,000 K. Ionized metals provide the most conspicuous lines in stars with temperatures from 6000 to 7500 K (spectral type F). In the coolest M stars (below 3500 K), absorption bands of titanium oxide and other molecules are very strong. By the way, the spectral class assigned to the Sun is G2. The sequence of spectral classes is summarized in Table.
Absorption Lines in Stars of Different Temperatures.
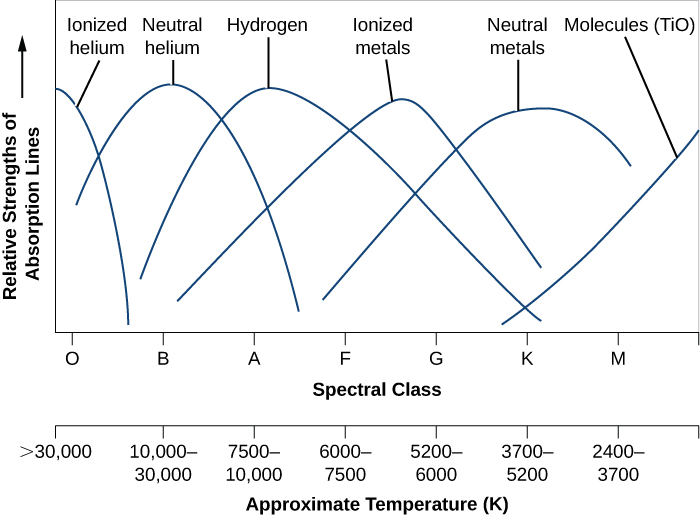
Figure 2. This graph shows the strengths of absorption lines of different chemical species (atoms, ions, molecules) as we move from hot (left) to cool (right) stars. The sequence of spectral types is also shown.
| Spectral Classes for Stars | ||||
|---|---|---|---|---|
| Spectral Class | Color | Approximate Temperature (K) | Principal Features | Examples |
| O | Blue | > 30,000 | Neutral and ionized helium lines, weak hydrogen lines | 10 Lacertae |
| B | Blue-white | 10,000–30,000 | Neutral helium lines, strong hydrogen lines | Rigel, Spica |
| A | White | 7500–10,000 | Strongest hydrogen lines, weak ionized calcium lines, weak ionized metal (e.g., iron, magnesium) lines | Sirius, Vega |
| F | Yellow-white | 6000–7500 | Strong hydrogen lines, strong ionized calcium lines, weak sodium lines, many ionized metal lines | Canopus, Procyon |
| G | Yellow | 5200–6000 | Weaker hydrogen lines, strong ionized calcium lines, strong sodium lines, many lines of ionized and neutral metals | Sun, Capella |
| K | Orange | 3700–5200 | Very weak hydrogen lines, strong ionized calcium lines, strong sodium lines, many lines of neutral metals | Arcturus, Aldebaran |
| M | Red | 2400–3700 | Strong lines of neutral metals and molecular bands of titanium oxide dominate | Betelgeuse, Antares |
| L | Red | 1300–2400 | Metal hydride lines, alkali metal lines (e.g., sodium, potassium, rubidium) | Teide 1 |
| T | Magenta | 700–1300 | Methane lines | Gliese 229B |
| Y | Infrared1 | < 700 | Ammonia lines | WISE 1828+2650 |
To see how spectral classification works, let’s use Figure 2. Suppose you have a spectrum in which the hydrogen lines are about half as strong as those seen in an A star. Looking at the lines in our figure, you see that the star could be either a B star or a G star. But if the spectrum also contains helium lines, then it is a B star, whereas if it contains lines of ionized iron and other metals, it must be a G star.
If you look at Figure 3, you can see that you, too, could assign a spectral class to a star whose type was not already known. All you have to do is match the pattern of spectral lines to a standard star (like the ones shown in the figure) whose type has already been determined.
Spectra of Stars with Different Spectral Classes.
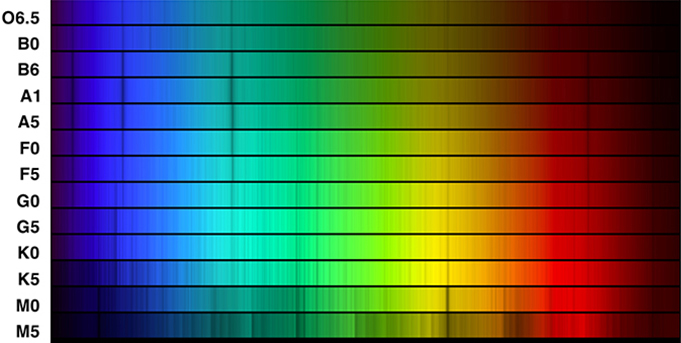
Figure 3. This image compares the spectra of the different spectral classes. The spectral class assigned to each of these stellar spectra is listed at the left of the picture. The strongest four lines seen at spectral type A1 (one in the red, one in the blue-green, and two in the blue) are Balmer lines of hydrogen. Note how these lines weaken at both higher and lower temperatures, as Figure 2 also indicates. The strong pair of closely spaced lines in the yellow in the cool stars is due to neutral sodium (one of the neutral metals in Figure 2). (Credit: modification of work by NOAO/AURA/NSF)
Both colors and spectral classes can be used to estimate the temperature of a star. Spectra are harder to measure because the light has to be bright enough to be spread out into all colors of the rainbow, and detectors must be sensitive enough to respond to individual wavelengths. In order to measure colors, the detectors need only respond to the many wavelengths that pass simultaneously through the colored filters that have been chosen—that is, to all the blue light or all the yellow-green light.
ANNIE CANNON: CLASSIFIER OF THE STARS
Annie Jump Cannon was born in Delaware in 1863 (Figure 4). In 1880, she went to Wellesley College, one of the new breed of US colleges opening up to educate young women. Wellesley, only 5 years old at the time, had the second student physics lab in the country and provided excellent training in basic science. After college, Cannon spent a decade with her parents but was very dissatisfied, longing to do scientific work. After her mother’s death in 1893, she returned to Wellesley as a teaching assistant and also to take courses at Radcliffe, the women’s college associated with Harvard.
Annie Jump Cannon (1863–1941).
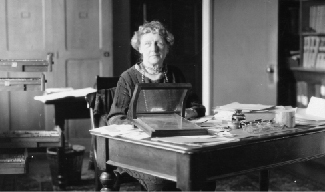
Figure 4. Cannon is well-known for her classifications of stellar spectra. (credit: modification of work by Smithsonian Institution)
In the late 1800s, the director of the Harvard Observatory, Edward C. Pickering, needed lots of help with his ambitious program of classifying stellar spectra. The basis for these studies was a monumental collection of nearly a million photographic spectra of stars, obtained from many years of observations made at Harvard College Observatory in Massachusetts as well as at its remote observing stations in South America and South Africa. Pickering quickly discovered that educated young women could be hired as assistants for one-third or one-fourth the salary paid to men, and they would often put up with working conditions and repetitive tasks that men with the same education would not tolerate. These women became known as the Harvard Computers. (We should emphasize that astronomers were not alone in reaching such conclusions about the relatively new idea of upper-class, educated women working outside the home: women were exploited and undervalued in many fields. This is a legacy from which our society is just beginning to emerge.)
Cannon was hired by Pickering as one of the “computers” to help with the classification of spectra. She became so good at it that she could visually examine and determine the spectral types of several hundred stars per hour (dictating her conclusions to an assistant). She made many discoveries while investigating the Harvard photographic plates, including 300 variable stars (stars whose luminosity changes periodically). But her main legacy is a marvelous catalog of spectral types for hundreds of thousands of stars, which served as a foundation for much of twentieth-century astronomy.
In 1911, a visiting committee of astronomers reported that “she is the one person in the world who can do this work quickly and accurately” and urged Harvard to give Cannon an official appointment in keeping with her skill and renown. Not until 1938, however, did Harvard appoint her an astronomer at the university; she was then 75 years old.
Cannon received the first honorary degree Oxford awarded to a woman, and she became the first woman to be elected an officer of the American Astronomical Society, the main professional organization of astronomers in the US. She generously donated the money from one of the major prizes she had won to found a special award for women in astronomy, now known as the Annie Jump Cannon Prize. True to form, she continued classifying stellar spectra almost to the very end of her life in 1941.
Spectral Classes L, T, and Y
The scheme devised by Cannon worked well until 1988, when astronomers began to discover objects even cooler than M9-type stars. We use the word object because many of the new discoveries are not true stars. A star is defined as an object that during some part of its lifetime derives 100% of its energy from the same process that makes the Sun shine—the fusion of hydrogen nuclei (protons) into helium. Objects with masses less than about 7.5% of the mass of our Sun (about 0.075 MSun) do not become hot enough for hydrogen fusion to take place. Even before the first such “failed star” was found, this class of objects, with masses intermediate between stars and planets, was given the name brown dwarfs.
Brown dwarfs are very difficult to observe because they are extremely faint and cool, and they put out most of their light in the infrared part of the spectrum. It was only after the construction of very large telescopes, like the Keck telescopes in Hawaii, and the development of very sensitive infrared detectors, that the search for brown dwarfs succeeded. The first brown dwarf was discovered in 1988, and, as of the summer of 2015, there are more than 2200 known brown dwarfs.
Initially, brown dwarfs were given spectral classes like M10+ or “much cooler than M9,” but so many are now known that it is possible to begin assigning spectral types. The hottest brown dwarfs are given types L0–L9 (temperatures in the range 2400–1300 K), whereas still cooler (1300–700 K) objects are given types T0–T9 (see Figure 5). In class L brown dwarfs, the lines of titanium oxide, which are strong in M stars, have disappeared. This is because the L dwarfs are so cool that atoms and molecules can gather together into dust particles in their atmospheres; the titanium is locked up in the dust grains rather than being available to form molecules of titanium oxide. Lines of steam (hot water vapor) are present, along with lines of carbon monoxide and neutral sodium, potassium, cesium, and rubidium. Methane (CH4) lines are strong in class-T brown dwarfs, as methane exists in the atmosphere of the giant planets in our own solar system.
In 2009, astronomers discovered ultra-cool brown dwarfs with temperatures of 500–600 K. These objects exhibited absorption lines due to ammonia (NH3), which are not seen in T dwarfs. A new spectral class, Y, was created for these objects. As of 2015, over two dozen brown dwarfs belonging to spectral class Y have been discovered, some with temperatures comparable to that of the human body (about 300 K).
Brown Dwarfs.
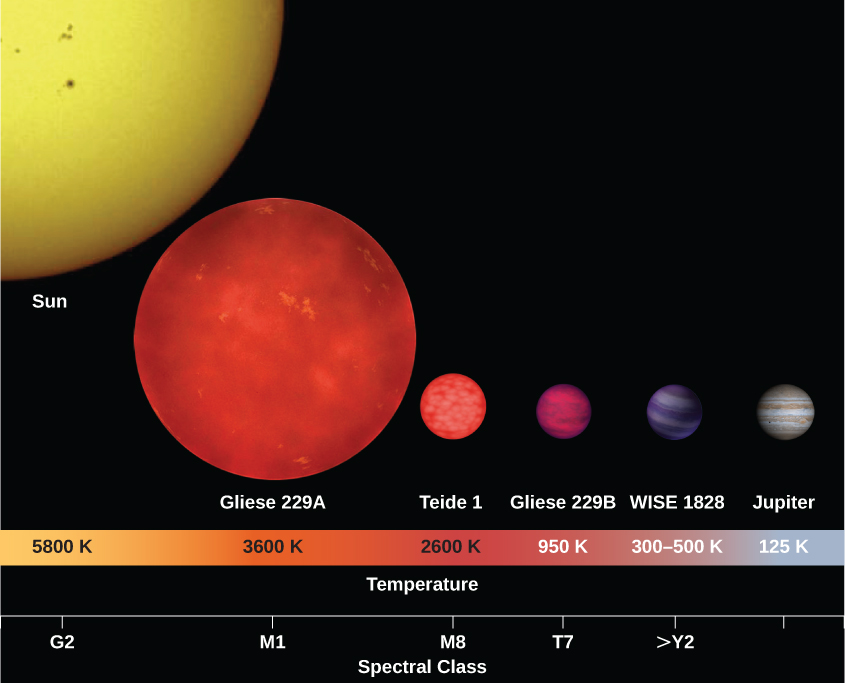
Figure 5. This illustration shows the sizes and surface temperatures of brown dwarfs Teide 1, Gliese 229B, and WISE1828 in relation to the Sun, a red dwarf star (Gliese 229A), and Jupiter. (credit: modification of work by MPIA/V. Joergens)
Most brown dwarfs start out with atmospheric temperatures and spectra like those of true stars with spectral classes of M6.5 and later, even though the brown dwarfs are not hot and dense enough in their interiors to fuse hydrogen. In fact, the spectra of brown dwarfs and true stars are so similar from spectral types late M through L that it is not possible to distinguish the two types of objects based on spectra alone. An independent measure of mass is required to determine whether a specific object is a brown dwarf or a very low mass star. Since brown dwarfs cool steadily throughout their lifetimes, the spectral type of a given brown dwarf changes with time over a billion years or more from late M through L, T, and Y spectral types.
Low-Mass Brown Dwarfs vs. High-Mass Planets
An interesting property of brown dwarfs is that they are all about the same radius as Jupiter, regardless of their masses. Amazingly, this covers a range of masses from about 13 to 80 times the mass of Jupiter (MJ). This can make distinguishing a low-mass brown dwarf from a high-mass planet very difficult.
So, what is the difference between a low-mass brown dwarf and a high-mass planet? The International Astronomical Union considers the distinctive feature to be deuterium fusion. Although brown dwarfs do not sustain regular (proton-proton) hydrogen fusion, they are capable of fusing deuterium (a rare form of hydrogen with one proton and one neutron in its nucleus). The fusion of deuterium can happen at a lower temperature than the fusion of hydrogen. If an object has enough mass to fuse deuterium (about 13 MJ or 0.012 MSun), it is a brown dwarf. Objects with less than 13 MJ do not fuse deuterium and are usually considered planets.
Key Concepts and Summary
The differences in the spectra of stars are principally due to differences in temperature, not composition. The spectra of stars are described in terms of spectral classes. In order of decreasing temperature, these spectral classes are O, B, A, F, G, K, M, L, T, and Y. These are further divided into subclasses numbered from 0 to 9. The classes L, T, and Y have been added recently to describe newly discovered star-like objects—mainly brown dwarfs—that are cooler than M9. Our Sun has spectral type G2.
Footnotes
Glossary
- brown dwarf
- an object intermediate in size between a planet and a star; the approximate mass range is from about 1/100 of the mass of the Sun up to the lower mass limit for self-sustaining nuclear reactions, which is about 0.075 the mass of the Sun; brown dwarfs are capable of deuterium fusion, but not hydrogen fusion
- spectral class
- (or spectral type) the classification of stars according to their temperatures using the characteristics of their spectra; the types are O, B, A, F, G, K, and M with L, T, and Y added recently for cooler star-like objects that recent survey have revealed
For Further Exploration
Articles
Berman, B. “Magnitude Cum Laude.” Astronomy (December 1998): 92. How we measure the apparent brightnesses of stars is discussed.
Dvorak, J. “The Women Who Created Modern Astronomy [including Annie Cannon].” Sky & Telescope (August 2013): 28.
Hearnshaw, J. “Origins of the Stellar Magnitude Scale.” Sky & Telescope (November 1992): 494. A good history of how we have come to have this cumbersome system is discussed.
Hirshfeld, A. “The Absolute Magnitude of Stars.” Sky & Telescope (September 1994): 35.
Kaler, J. “Stars in the Cellar: Classes Lost and Found.” Sky & Telescope (September 2000): 39. An introduction is provided for spectral types and the new classes L and T.
Kaler, J. “Origins of the Spectral Sequence.” Sky & Telescope (February 1986): 129.
Skrutskie, M. “2MASS: Unveiling the Infrared Universe.” Sky & Telescope (July 2001): 34. This article focuses on an all-sky survey at 2 microns.
Sneden, C. “Reading the Colors of the Stars.” Astronomy (April 1989): 36. This article includes a discussion of what we learn from spectroscopy.
Steffey, P. “The Truth about Star Colors.” Sky & Telescope (September 1992): 266. The color index and how the eye and film “see” colors are discussed.
Tomkins, J. “Once and Future Celestial Kings.” Sky & Telescope (April 1989): 59. Calculating the motion of stars and determining which stars were, are, and will be brightest in the sky are discussed.
Websites
Discovery of Brown Dwarfs: http://w.astro.berkeley.edu/~basri/bdwarfs/SciAm-book.pdf.
Listing of Nearby Brown Dwarfs: http://www.solstation.com/stars/pc10bd.htm.
Spectral Types of Stars: http://www.skyandtelescope.com/astronomy-equipment/the-spectral-types-of-stars/.
Stellar Velocities https://www.e-education.psu.edu/astro801/content/l4_p7.html.
Unheard Voices! The Contributions of Women to Astronomy: A Resource Guide: http://multiverse.ssl.berkeley.edu/women and http://www.astrosociety.org/education/astronomy-resource-guides/women-in-astronomy-an-introductory-resource-guide/.
Videos
When You Are Just Too Small to be a Star: https://www.youtube.com/watch?v=zXCDsb4n4KU. 2013 Public Talk on Brown Dwarfs and Planets by Dr. Gibor Basri of the University of California–Berkeley (1:32:52).
Collaborative Group Activities
- The Voyagers in Astronomy feature on Annie Cannon: Classifier of the Stars discusses some of the difficulties women who wanted to do astronomy faced in the first half of the twentieth century. What does your group think about the situation for women today? Do men and women have an equal chance to become scientists? Discuss with your group whether, in your experience, boys and girls were equally encouraged to do science and math where you went to school.
- In the section on magnitudes in The Brightness of Stars, we discussed how this old system of classifying how bright different stars appear to the eye first developed. Your authors complained about the fact that this old system still has to be taught to every generation of new students. Can your group think of any other traditional systems of doing things in science and measurement where tradition rules even though common sense says a better system could certainly be found. Explain. (Hint: Try Daylight Savings Time, or metric versus English units.)
- Suppose you could observe a star that has only one spectral line. Could you tell what element that spectral line comes from? Make a list of reasons with your group about why you answered yes or no.
- A wealthy alumnus of your college decides to give $50 million to the astronomy department to build a world-class observatory for learning more about the characteristics of stars. Have your group discuss what kind of equipment they would put in the observatory. Where should this observatory be located? Justify your answers. (You may want to refer back to the Astronomical Instruments chapter and to revisit this question as you learn more about the stars and equipment for observing them in future chapters.)
- For some astronomers, introducing a new spectral type for the stars (like the types L, T, and Y discussed in the text) is similar to introducing a new area code for telephone calls. No one likes to disrupt the old system, but sometimes it is simply necessary. Have your group make a list of steps an astronomer would have to go through to persuade colleagues that a new spectral class is needed.
Review Questions
What two factors determine how bright a star appears to be in the sky?
Explain why color is a measure of a star’s temperature.
What is the main reason that the spectra of all stars are not identical? Explain.
What elements are stars mostly made of? How do we know this?
What did Annie Cannon contribute to the understanding of stellar spectra?
Name five characteristics of a star that can be determined by measuring its spectrum. Explain how you would use a spectrum to determine these characteristics.
How do objects of spectral types L, T, and Y differ from those of the other spectral types?
Do stars that look brighter in the sky have larger or smaller magnitudes than fainter stars?
The star Antares has an apparent magnitude of 1.0, whereas the star Procyon has an apparent magnitude of 0.4. Which star appears brighter in the sky?
Based on their colors, which of the following stars is hottest? Which is coolest? Archenar (blue), Betelgeuse (red), Capella (yellow).
Order the seven basic spectral types from hottest to coldest.
What is the defining difference between a brown dwarf and a true star?
Thought Questions
If the star Sirius emits 23 times more energy than the Sun, why does the Sun appear brighter in the sky?
How would two stars of equal luminosity—one blue and the other red—appear in an image taken through a filter that passes mainly blue light? How would their appearance change in an image taken through a filter that transmits mainly red light?
This table lists the temperature ranges that correspond to the different spectral types. What part of the star do these temperatures refer to? Why?
Suppose you are given the task of measuring the colors of the brightest stars, listed in Appendix J, through three filters: the first transmits blue light, the second transmits yellow light, and the third transmits red light. If you observe the star Vega, it will appear equally bright through each of the three filters. Which stars will appear brighter through the blue filter than through the red filter? Which stars will appear brighter through the red filter? Which star is likely to have colors most nearly like those of Vega?
Star X has lines of ionized helium in its spectrum, and star Y has bands of titanium oxide. Which is hotter? Why? The spectrum of star Z shows lines of ionized helium and also molecular bands of titanium oxide. What is strange about this spectrum? Can you suggest an explanation?
The spectrum of the Sun has hundreds of strong lines of nonionized iron but only a few, very weak lines of helium. A star of spectral type B has very strong lines of helium but very weak iron lines. Do these differences mean that the Sun contains more iron and less helium than the B star? Explain.
What are the approximate spectral classes of stars with the following characteristics?
- Balmer lines of hydrogen are very strong; some lines of ionized metals are present.
- The strongest lines are those of ionized helium.
- Lines of ionized calcium are the strongest in the spectrum; hydrogen lines show only moderate strength; lines of neutral and metals are present.
- The strongest lines are those of neutral metals and bands of titanium oxide.
Look at the chemical elements in Appendix K. Can you identify any relationship between the abundance of an element and its atomic weight? Are there any obvious exceptions to this relationship?
Appendix I lists some of the nearest stars. Are most of these stars hotter or cooler than the Sun? Do any of them emit more energy than the Sun? If so, which ones?
Appendix J lists the stars that appear brightest in our sky. Are most of these hotter or cooler than the Sun? Can you suggest a reason for the difference between this answer and the answer to the previous question? (Hint: Look at the luminosities.) Is there any tendency for a correlation between temperature and luminosity? Are there exceptions to the correlation?
What star appears the brightest in the sky (other than the Sun)? The second brightest? What color is Betelgeuse? Use Appendix J to find the answers.
Suppose hominids one million years ago had left behind maps of the night sky. Would these maps represent accurately the sky that we see today? Why or why not?
Why can only a lower limit to the rate of stellar rotation be determined from line broadening rather than the actual rotation rate? (Refer to Figure.)
Why do you think astronomers have suggested three different spectral types (L, T, and Y) for the brown dwarfs instead of M? Why was one not enough?
Sam, a college student, just bought a new car. Sam’s friend Adam, a graduate student in astronomy, asks Sam for a ride. In the car, Adam remarks that the colors on the temperature control are wrong. Why did he say that?

Would a red star have a smaller or larger magnitude in a red filter than in a blue filter?
Two stars have proper motions of one arcsecond per year. Star A is 20 light-years from Earth, and Star B is 10 light-years away from Earth. Which one has the faster velocity in space?
Suppose there are three stars in space, each moving at 100 km/s. Star A is moving across (i.e., perpendicular to) our line of sight, Star B is moving directly away from Earth, and Star C is moving away from Earth, but at a 30° angle to the line of sight. From which star will you observe the greatest Doppler shift? From which star will you observe the smallest Doppler shift?
What would you say to a friend who made this statement, “The visible-light spectrum of the Sun shows weak hydrogen lines and strong calcium lines. The Sun must therefore contain more calcium than hydrogen.”?
Figuring for Yourself
In Appendix J, how much more luminous is the most luminous of the stars than the least luminous?
For these questions, use the equations relating magnitude and apparent brightness given in the section on the magnitude scale in The Brightness of Stars and this example.
Verify that if two stars have a difference of five magnitudes, this corresponds to a factor of 100 in the ratio (b2b1);(b2b1); that 2.5 magnitudes corresponds to a factor of 10; and that 0.75 magnitudes corresponds to a factor of 2.
As seen from Earth, the Sun has an apparent magnitude of about −26.7. What is the apparent magnitude of the Sun as seen from Saturn, about 10 AU away? (Remember that one AU is the distance from Earth to the Sun and that the brightness decreases as the inverse square of the distance.) Would the Sun still be the brightest star in the sky?
An astronomer is investigating a faint star that has recently been discovered in very sensitive surveys of the sky. The star has a magnitude of 16. How much less bright is it than Antares, a star with magnitude roughly equal to 1?
The center of a faint but active galaxy has magnitude 26. How much less bright does it look than the very faintest star that our eyes can see, roughly magnitude 6?
You have enough information from this chapter to estimate the distance to Alpha Centauri, the second nearest star, which has an apparent magnitude of 0. Since it is a G2 star, like the Sun, assume it has the same luminosity as the Sun and the difference in magnitudes is a result only of the difference in distance. Estimate how far away Alpha Centauri is. Describe the necessary steps in words and then do the calculation. (As we will learn in the Celestial Distances chapter, this method—namely, assuming that stars with identical spectral types emit the same amount of energy—is actually used to estimate distances to stars.) If you assume the distance to the Sun is in AU, your answer will come out in AU.
Do the previous problem again, this time using the information that the Sun is 150,000,000 km away. You will get a very large number of km as your answer. To get a better feeling for how the distances compare, try calculating the time it takes light at a speed of 299,338 km/s to travel from the Sun to Earth and from Alpha Centauri to Earth. For Alpha Centauri, figure out how long the trip will take in years as well as in seconds.
Star A and Star B have different apparent brightnesses but identical luminosities. If Star A is 20 light-years away from Earth and Star B is 40 light-years away from Earth, which star appears brighter and by what factor?
Star A and Star B have different apparent brightnesses but identical luminosities. Star A is 10 light-years away from Earth and appears 36 times brighter than Star B. How far away is Star B?
The star Sirius A has an apparent magnitude of −1.5. Sirius A has a dim companion, Sirius B, which is 10,000 times less bright than Sirius A. What is the apparent magnitude of Sirius B? Can Sirius B be seen with the naked eye?
Our Sun, a type G star, has a surface temperature of 5800 K. We know, therefore, that it is cooler than a type O star and hotter than a type M star. Given what you learned about the temperature ranges of these types of stars, how many times hotter than our Sun is the hottest type O star? How many times cooler than our Sun is the coolest type M star?
Glossary
- giant
- a star of exaggerated size with a large, extended photosphere
- proper motion
- the angular change per year in the direction of a star as seen from the Sun
- radial velocity
- motion toward or away from the observer; the component of relative velocity that lies in the line of sight
- space velocity
- the total (three-dimensional) speed and direction with which an object is moving through space relative to the Sun
